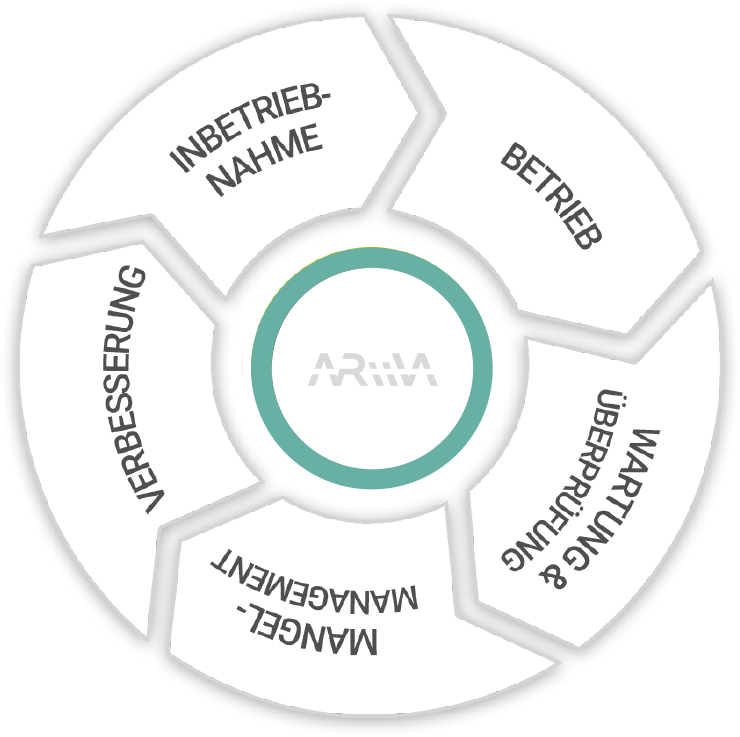
ARiiVA delivers data where it is needed and supports the operation of professional service life cycle management.
1. GETTING STARTED
Jeder neue Benutzer erhält einen Zugang mit 2 limitierten Benutzer und 100 Dataspots.
ARiiVA Home is the central user and data management platform. Machine and inventory data will be imported here. Maintenance cycles can be defined. All information that is entered here will become available in the mobile application ARiiVA Go instantaneously.
Durch ARiiVA Go sind Daten mobil verfügbar und können mittels Augmented Reality-Feature (ARiiVA Dataspots) eingeblendet werden. User können unterwegs Tickets erstellen, inklusive Bild-Dokumentation und Markup-Funktionalität, Hier kann auch der Status aller Assets (z.B. Maschinen) mittels Monitoring im Blick behalten werden. ARiiVA Go unterstützt ebenso Video- oder Audio-Calls und zeigt sämtliche verfügbaren Analysedaten.
In order to be able to make use of all ARiiVA functions and features, we recommend the use of both systems simultaneously. However, ARiiVA Home and ARiiVA Go do work independently of each other.
2. SYSTEM & SUPPORT
ARiiVA Home is tested for all current browsers on Windows, Macintosh and Linux systems.
NOTE: Support for Microsoft Internet Explorer has been discontinued. Our goal is to offer highest product and service quality to all customers at best security standards. Therefore, we recommend the use of newest Google Chrome, Mozilla Firefox or Microsoft Edge browsers. Learn more here: Chrome / Firefox / Microsoft Edge.
ARiiVA Home is a web-based application and thus has no requirements regarding operating system but rather on the used browser (see above).
ARiiVA Go is compatible with Android and iOS.
ARiiVA Home is a browser-based application and thus no updates on client computers are required. Updates in the platform usually happen over night. If taking ARiiVA Home offline is necessary, users will be notified in advance about any short downtimes.
Updates for ARiiVA Go (mobile application) will be rolled out via mobile stores (Google Play or Apple App Store). According to user preferences this will happen automatically or has to be done manually.
User data and preferences will not be lost.
Please use the support request form in www.ariiva.com --> More --> Support. Response time within 48 hours.
3. FEATURES
Dataspots are managed centrally in ARiiVA Home (menu item: Dataspots), information such as displaying the maintenance date, free text, images, documents, and tickets are the central functions of the Dataspots. After registration, a PDF with the available Dataspots is generated (ARiiVA Home> Dataspots> a download link can be found at the bottom.
With the help of the ARiiVA Go mobile app, this information can be displayed directly on the machine using augmented reality support.
ARiiVA Ticketing allows quick creation of service tickets for assets (dataspots). It contains a photo and drawing feature which enables the ticket creator to describe the issue at hand as best as possible. Service time estimations can be entered. Staff can be notified directly through the ticket creation process.
Monitorings sind Datenobjekte die als Containter für Assets (Dataspots) oder andere Sub-Monitorings dienen. Standort-Monitorings haben einen Status (z.B. aktiv, inaktiv, in Bearbeitung, etc.). User sehen so auf einen Blick, ob bestimmte Assets oder Produktionsbereiche derzeit verfügbar sind oder ggf. Reparaturbedarf herrscht.
ARiiVA Call establishes a direct 1:1 connection between remote expert and field/service engineer through data glasses, smartphone or tablet computer. ARiiVA Call allows both sides to see exaclty the same picture which enables the remote expert to give instructions on how to solve an issue. This reduces service times and travel cost significantly.
ARiiVA Analytics helps analyze data flows and fields for optimizations. Every data entry in ARiiVA is constantly being monitored and relevant results such as productivity, downtimes, utilization, asset condition down to service cost become transparent.


