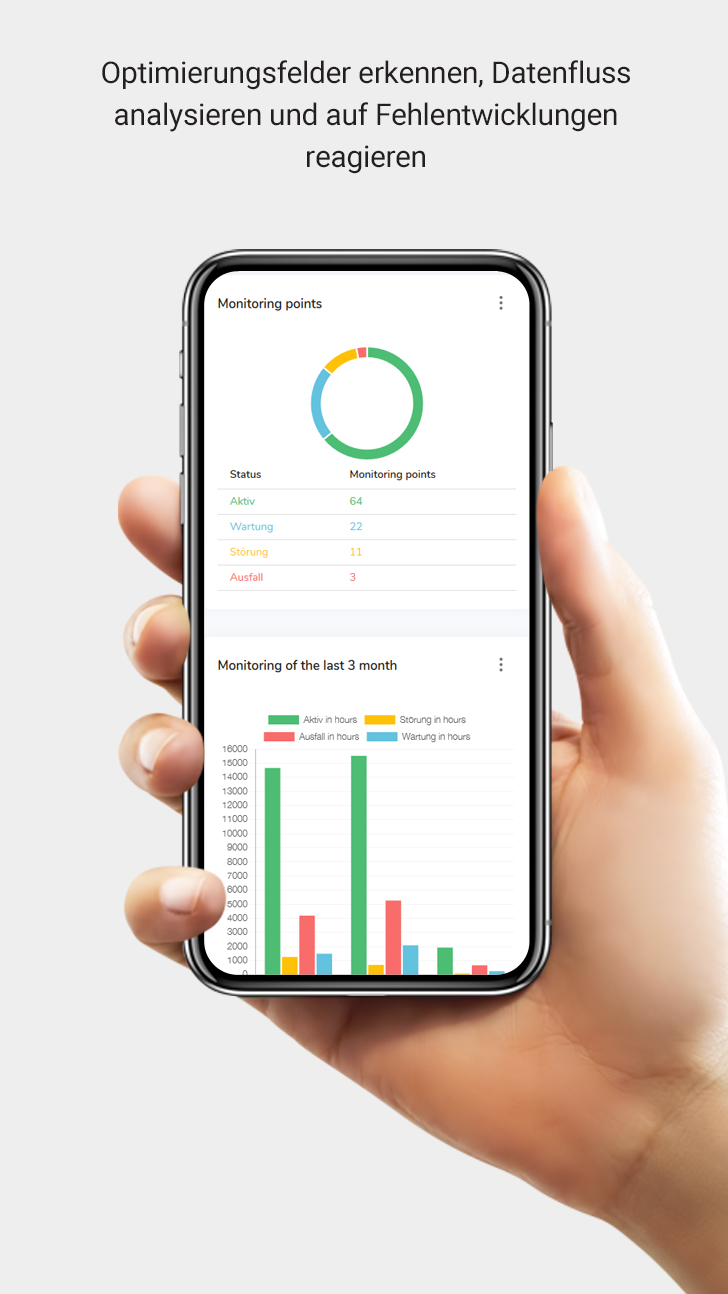


Detect areas for optimization
All data in ARiiVA is permanently analyzed and visualized in self-explanatory diagrams in the analytics section.
Analyze data flows
What is the current ticket response time? How about the new machine? Are there significant downtimes in any stages of production?
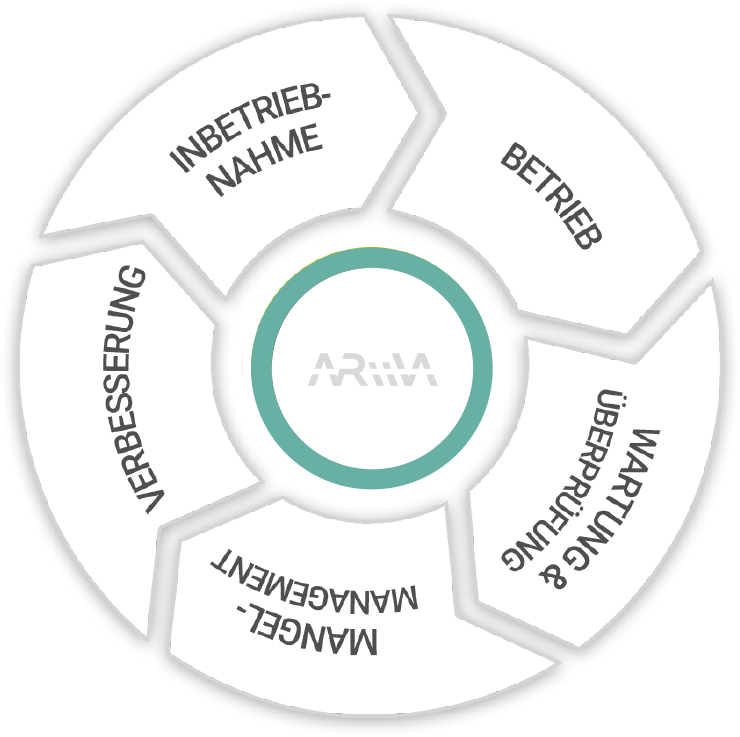
Manage data flows
Recognize deviations early and take corrective measures where necessary